If you are still buying inventory based on a “gut feeling” or just looking at who had a hit five years ago, you are basically leaving money on the table. The game has changed. Today, the smartest brokers are using streaming data to see the market before it moves. Here is how to decode the charts to find your next big win.
The “Local Bump” is Real
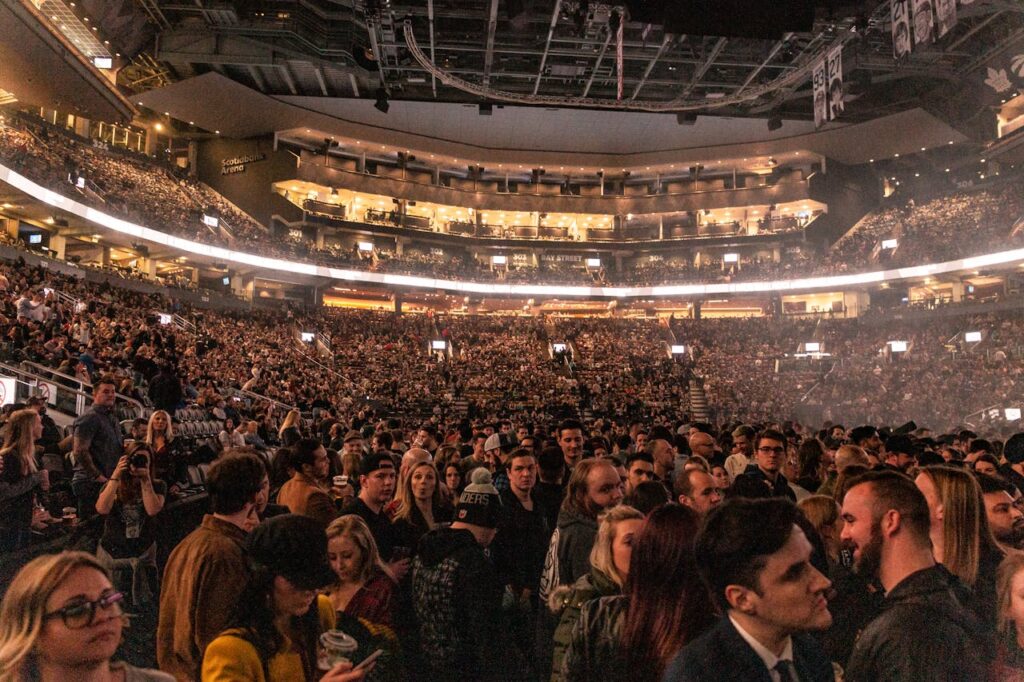
Data from nearly 1,000 shows proves that concerts and streaming live in a symbiotic loop. During a concert week, an artist usually sees a median growth of 42% in local streaming. But here is the kicker: that growth changes wildly depending on the genre.
| Genre | Median Local Streaming Growth (Event Week) |
| Electronic/Dance | 143% |
| Rock | 63% |
| Pop | 53% |
| Latin | 35% |
| Hip-Hop/R&B | 20% |
If you see an Electronic act climbing the charts, pay attention. Their fans are digital-first and highly engaged, which translates to massive demand for “eventized” live experiences.
Spotify vs. Apple Music vs. YouTube: Know Your Audience
Not all streams tell the same story. Each platform has its own vibe and demographic profile that dictates ticket-buying power.
- Spotify (The Discovery Machine): With a 36% subscriber share in the U.S., Spotify is where virality happens. It is perfect for spotting breakout stars like Sabrina Carpenter or Benson Boone. Sabrina’s explosive leap from 2,898 to 13,725 average tickets per show was visible in her streaming rank weeks before the tour went on sale.
- Apple Music (The High-Value Vault): Apple Music users are older (45% are aged 25 to 44) and often more affluent. This platform is the “King of Hip-Hop” charts. If an artist is dominating here, they likely have a stable floor of fans with disposable income.
- YouTube (The Global Powerhouse): YouTube is essential for K-Pop and Latin music. In 2025, Stray Kids hit 2.86 billion global streams, but only 5% of that came from South Korea. This signals massive international touring potential that traditional U.S. radio might miss.
Keep in mind that as of early 2026, YouTube data is no longer included in Billboard’s official rankings. You have to monitor YouTube Music’s internal charts directly to catch these signals now.
The Secret Sauce: Audio Features and Longevity
Can you predict a superstar just by the sound of their music? Actually, yes. Top ticket-sellers typically have tracks with higher energy, more loudness, and lower “acousticness”.
The biggest indicators of a “buy” signal are:
- Number of Releases: More tracks equals more fan engagement.
- Spotify Popularity Index: A high score here is a major predictor of success.
- Market Longevity: Top sellers have been active for an average of 14 years with 34 tracks in their catalog.
A viral TikTok hit from an artist with only two songs is a gamble. An artist with a decade of work and a new streaming spike is a much safer bet.
Strategy: Buy the Dip and Watch the Clock
Timing your acquisition is everything. Strong activity during a “Fans First” presale is your biggest signal that demand is about to explode.
Professional brokers use tools like DataVue to analyze real resale transactions: we are talking $7 billion in historical data: rather than just looking at what people are asking for in listings.
Also, watch for the “January Lull.” Consumers often tighten their belts after the holidays, which can lead to slower sales for March shows. If an artist’s streaming velocity remains high during a sales slump, that is your cue to “buy the dip” before demand bounces back for the spring tour leg.
The Bottom Line
Streaming momentum is the new box office. Whether it is Sabrina Carpenter’s “explosive leap” or Imagine Dragons selling 1.48 million tickets in a single year, the data is all there if you know where to look. Stop guessing and start counting the streams.
Sources:
https://djrobblog.com/archives/24087
https://luminatedata.com/blog/the-shared-impact-of-touring-and-streaming/
https://stagefront.com/news/whats-the-best-way-to-predict-ticket-demand
https://medium.com/@lukelom/what-does-top-of-the-charts-mean-250df3c137d0
https://www.ticketfairy.com/blog/ticketing-strategies-for-festival-producers
https://arxiv.org/html/2508.11632v1
https://luminatedata.com/blog/the-shared-impact-of-touring-and-streaming/
https://www.reddit.com/r/kpopthoughts/comments/1q59s17/4th_gen_youtube_music_streams_globally_vs/
https://www.brushfire.com/resources/5-seasonal-strategies-for-daily-ticketing/
https://stagefront.com/news/whats-the-best-way-to-predict-ticket-demand